
 Facebook
 X
X
 Pinterest
 Copy Link

A New Year always brings new energy to the real estate market, and 2026 is already starting to show signs of growth, more movement, and a return to normalcy. After three years of slower sales due to higher interest rates, homeowners not wanting to give up their historically low interest rates, and prices remaining stable, 2026 is starting to produce some positive results in the Greater Seattle area real estate market. Some key factors that I have been tracking since the calendar flipped to 2026 that show predictive trends are the rate of:
- New Listings
- Pending Sales (Real-Time Accepted Contracts)
- Cumulative Days on Market (CDOM)
- Sales Prices to Original List Price Ratios
- Months of Inventory (Is it a Seller’s, Balanced or Buyer’s Market?)
- Interest Rates
- Price Trajectory
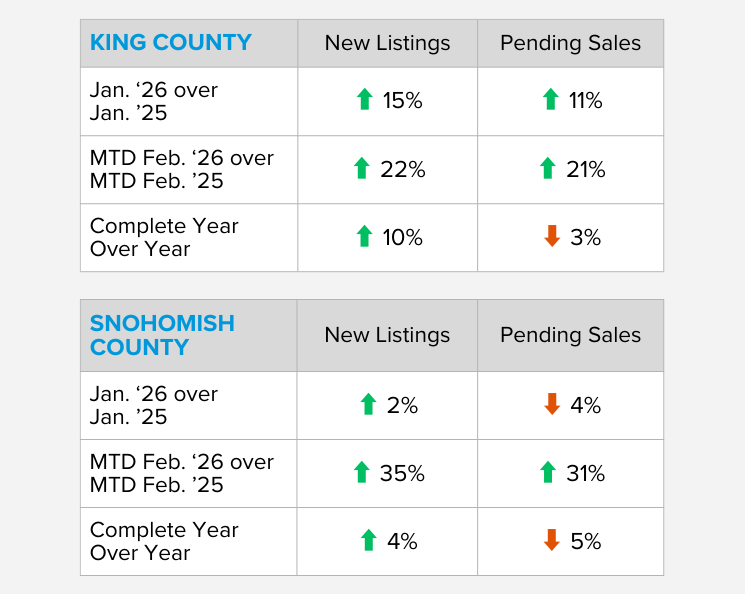
One of the challenges we have faced over the last three years is a lack of inventory, with many would-be home sellers staying in their homes longer in order to hold onto their low rate and payment. This has led people to stay in homes that are not the best fit for their lifestyle, and this pent-up seller demand has started to break loose. As you can see from the chart above, New Listings are up in both King and Snohomish Counties year-over-year, especially this February. This shows that for some sellers, the time has come to focus on the right fit versus payment.
Additionally, another encouraging sign is an uptick in Pending Sales (Real-Time Accepted Contracts) year-over-year and most recently during the first two weeks of February compared to the same time last year. This illustrates that buyer demand is meeting the increase in new listings and that there is a ready and willing audience wanting more selection to choose from. When the increase in pending sales starts to pace and even outpace the rate of new listings, we know there is solid demand.
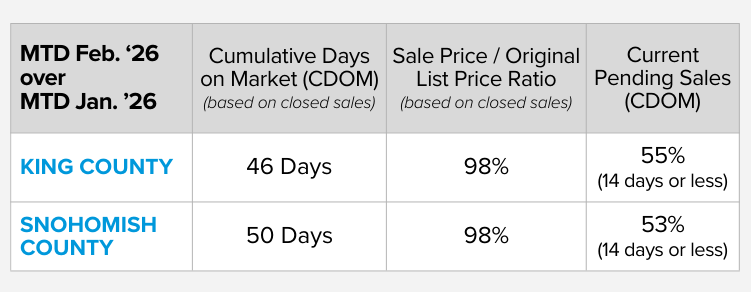
The most current data above for both King and Snohomish counties shows the Cumulative Days on Market (CDOM) for the current pending sales that were accepted since January 1, 2026; more than half quickly came off the market in two weeks or less! This is a stark difference from the CDOM for closed sales in January 2026, which most likely went pending (contract accepted) in late Q4 2025. The market is waking up to the New Year with vigor and excitement for well-prepared, appropriately priced homes.
The sales price to original list price ratios are also starting to improve, inching up to 98% in the first two weeks in February 2026 from 96% in January 2026. Home sellers that are aligning with a trusted advisor to help them prepare their home for market and stay close to the data for pricing are starting to see quicker, full-price sales, and in some cases, multiple offers with price escalations. It is important to note that property condition, cleanliness, expert staging and marketing, and realistic pricing all play a critical role in garnering optimal results.
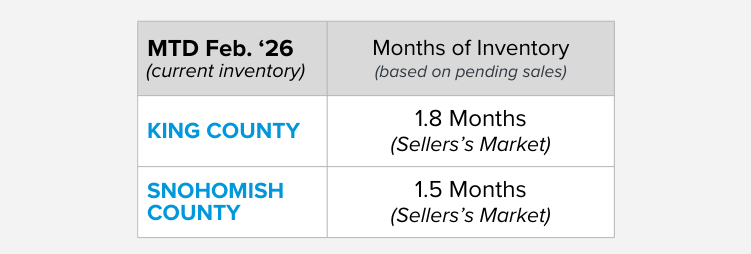
This finds us currently (MTD February 2026) in a Seller’s Market based on pending sales (0-2 Months of Inventory) in both King and Snohomish counties after only being 45 days into 2026. We calculate Months of Inventory by dividing the number of pending sales by the number of available homes for sale to determine how quickly we’d run out of inventory if no new homes came to market based on pending sales demand. We have not been at this level since April 2025 and spent the remainder of 2025 in a balanced market, so this is a marked improvement.
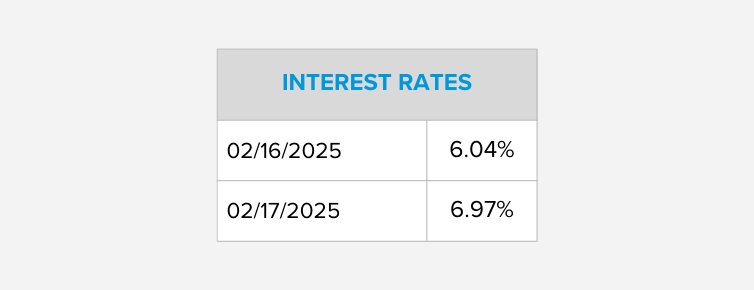
Interest rates are almost an entire point lower than they were last year at this time, which affords a buyer 10% more in buying power or simply results in a lower payment at the same sales price. You can view the video from Jeff Tucker, Windermere’s Chief Economist, below on what has caused interest rates to decrease. Rates declining closer to 6% and teetering towards the high 5% will unleash more demand in the market as it makes homes more affordable, and with prices maintaining, the rate matters! I think this has also led more potential home sellers to come to market as the current rates are more palatable than when they were 1-2 points higher over the last three years.
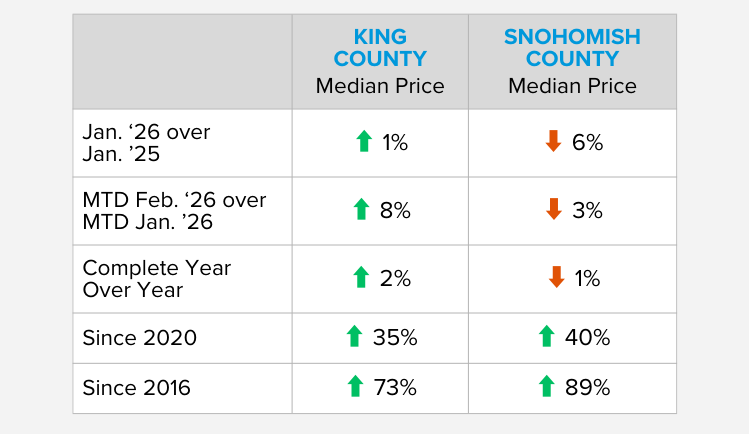
This brings us to price trajectory. With eight months of 2025 being a balanced market, rates hovering in the 7% throughout last year, and many of the homes that closed in January 2026 going under contract in late 2025, January prices recorded at lower price levels. When you take the median price over the last 12 months and compare it to the previous 12 months (complete year-over-year), prices are flat and stable.
With early indicators such as pending sales, lower rates, and faster CDOM, I anticipate more historical price growth levels in 2026, between 3-5%. I certainly do not anticipate prices lowering. In fact, we have seen list prices soften, and more home sellers who are truly motivated come to market with realistic expectations and better market preparation. The new normal is taking shape.
This uptick in market activity and return to normalcy comes on the shoulders of extreme home equity growth since 2020 and over the last 10 years. The growth is staggering! The abundance of wealth that people have in their homes is beneficial to positioning a move that better fits their lifestyle, funding a remodel, helps plan for retirement, or even an out-of-state move as long at the payment works. The recent decrease in rate and long-term equity gains have supported these exciting moves.
If you or someone you know are curious about how the latest trends, long-term growth in the market, and current rates affect your ability to make a move, please reach out. I am committed to staying close to the real-time data, assisting with discerning the information, and applying it to my clients’ goals to help them navigate big life changes. It is my mission to help keep my clients informed, so they are empowered to make strong decisions. 2026 is already starting to provide some great opportunities, and if you’d like to learn more, let’s talk!
